
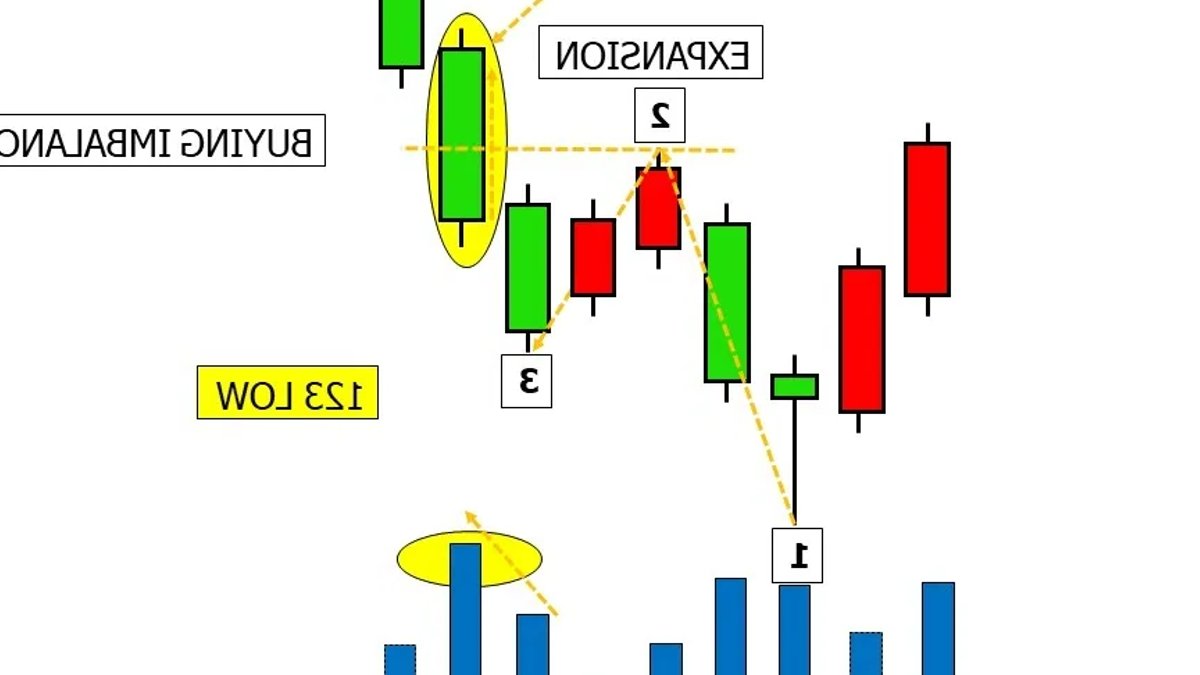
The 123 Low is a price action pattern traders use to identify potential bullish reversals after a downtrend. It combines swing points with volume signals to confirm a shift in market momentum.
How the 123 Low pattern works
The setup consists of three key points on a price chart. The first is the initial swing low, marking the lowest point of the downtrend. At this level, traders frequently observe reversal candlestick patterns such as a Hammer or Bullish Engulfing, accompanied by increased trading volume. These signs indicate sellers are losing strength while buyers begin entering the market.
The second point is the swing high that follows, representing the peak of the initial rebound. The third point is another swing low, but this one must sit above the first. When price moves past the second point—often on a strong bullish candle—the pattern is considered valid, marking the beginning of an uptrend.
This sequence forms higher lows and higher highs, a standard indicator of upward momentum. The breakout above the second point remains essential; without it, the pattern lacks confirmation.
Volume tells the real story
Volume serves as a critical validation tool for the 123 Low. At the first swing low, high volume often emerges as panicked sellers exit and aggressive buyers absorb available supply. This phenomenon, sometimes called “bullish absorption,” occurs when buy limit orders soak up sell market orders, halting further price declines.
The rally from the first low to the swing high typically shows strong volume, reinforcing buyer control. If volume declines during the pullback to the third point, it suggests selling pressure is easing. When price finally breaks above the swing high, volume usually spikes again as traders enter long positions, driving prices upward.
Related: Italy stronger than before says Meloni
Traders using breakout or trend-following strategies often wait for this breakout before taking positions. The sudden influx of buy orders can create an imbalance where demand outpaces supply, accelerating the upward movement.
The 123 Low helps filter out false breakouts. A weak rebound with low volume, for instance, may indicate a temporary bounce rather than a true reversal. The pattern requires confirmation before assuming the trend has changed.
The opposite of this setup is the 123 High, which appears at the end of an uptrend and signals a potential bearish reversal. Both patterns follow the same principle: a change in the sequence of highs and lows, supported by volume.
The pattern’s value lies in its alignment with actual market behavior. The first low often surprises traders, who may expect the downtrend to continue. By the time the third low forms and price breaks higher, the shift in sentiment becomes clear. Volume spikes at key points provide additional confirmation, reducing the risk of misinterpreting a temporary bounce as a full reversal.
No pattern guarantees success. Markets can reverse without hitting all three points, or break out only to reverse again. While the 123 Low doesn’t remove risk, it offers a structured way to identify high-probability setups.
The reliance on swing points and volume makes the pattern adaptable across different timeframes, from intraday charts to weekly trends. This versatility keeps it popular among traders who prefer price action over indicators.


Leave a Reply