
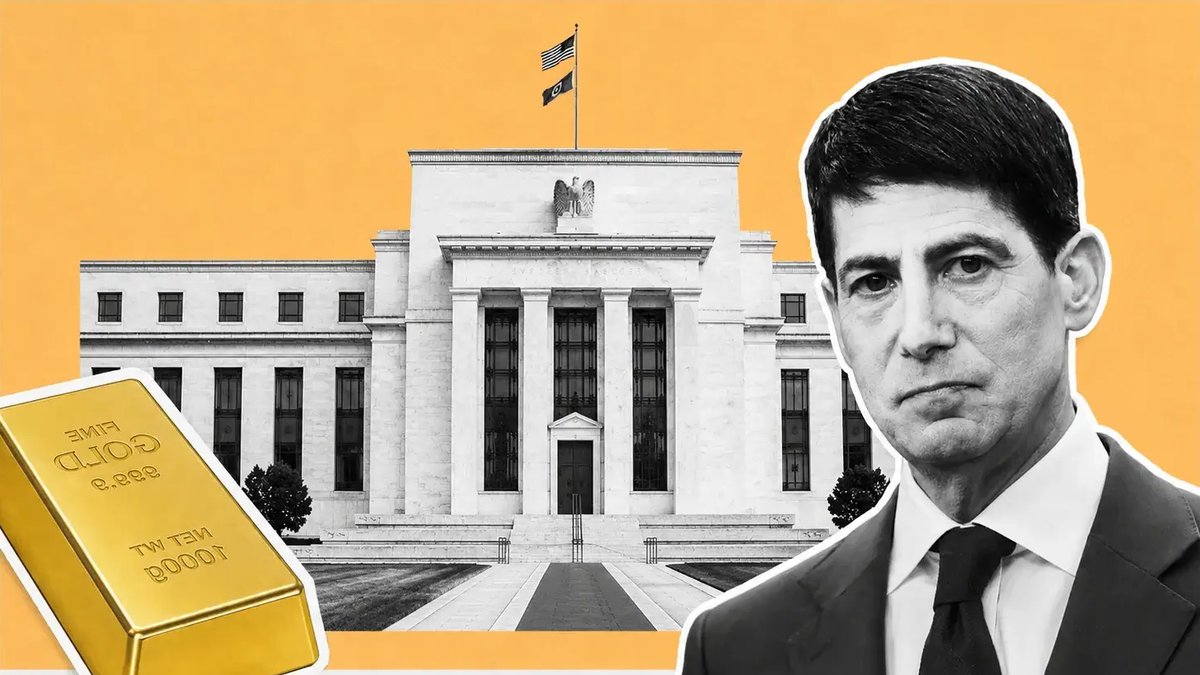
Gold surged 2.5% to $4,526 an ounce Thursday after Federal Reserve Governor Christopher Waller signaled he would support holding interest rates steady in September if inflation continues cooling. The move pushed the metal back above $4,450 after it had fallen to a three-week low of $4,282.67 earlier in the week. September rate-hike odds dropped to 48% from nearly 70% one day earlier, with the 2-year Treasury yield sliding six basis points to 4.33%.
The Rate Trade Reclaims Control
Waller told reporters that underlying inflation is performing better than core figures suggest, that he does not expect much from Friday’s jobs report, and that he favors patience ahead of the August consumer price index reading due September 10. CME FedWatch tools showed the probability of a September hike falling to 48% from roughly 68% just two sessions prior, a 20-point swing in two days. The 10-year yield retreated to 4.75% after touching 4.818% Wednesday, its highest print since November 2023.
Gold is a non-yielding asset, which means every basis point the market removes from expected policy rates lowers the opportunity cost of holding it. That relationship has driven the market for three weeks, making a single governor’s remarks worth $111.60 an ounce. The dollar index fell more than 0.5% and broke below 99, with global funds reportedly carrying their lowest dollar hedge ratios since 2015.
Related: PSI Fund Beats SOXX Holds Sector Growth Segment
Oil Shock Overwhelmed the Safe-Haven Bid
The behavioral shift worth noting: gold fell during last week’s Iran escalation when the United States resumed strikes on Iranian targets and Iran responded with drone and missile fire on American bases. Brent crude surged 9% across three sessions and settled above $95. Under traditional models, that should have been a textbook gold catalyst.
Instead, gold dropped 3.25% on the week. The mechanism traced through oil to inflation expectations to Treasury yields to dollar strength, with rate-hike pricing surging from 36% to 68% in a matter of days. All three of those — higher real yields, a stronger dollar, and a Fed leaning toward tightening — are gold negatives, and together they overwhelmed the safe-haven bid entirely. The same shock that would have sent gold to a record in a rate-cutting environment sent it to a three-week low in a rate-hiking one.
Technical Picture: Damaged But Defended
Wednesday’s low at $4,282.67 marked the third test of the low-$4,300s in eight sessions, each producing a reversal. XAU/USD opened at $4,328.36 that day, collapsed to the low, then bounced to $4,397.37 and closed near $4,389.22 — a $114.70 intraday range representing 2.68% top to bottom. Thursday extended that recovery as buyers reclaimed $4,400 during Asian trading and pressed toward the $4,440 to $4,460 supply zone that has capped every attempt since the decline began.
Related: Bitcoin Surges Past $77K as Shorts Wiped Out
The $4,440 to $4,470 band is significant not for Fibonacci reasons but because every buyer from the $4,600 to $4,700 zone in mid-August is now looking for an exit on strength. That is overhead supply waiting to be absorbed. A close above $4,470 on the daily with the dollar holding below 99 would shift the structure. A rejection there leaves $4,282.67 as the next target.
Multi-timeframe reads disagree in an informative way. Hourly and four-hour charts have transitioned from bearish impulse into recovery with momentum turning constructively higher. The daily chart remains corrective. Weekly and monthly signals stay buy-rated. That is a market where short-term traders are covering while long-term holders never left — a configuration that produces sharp bounces stalling at obvious resistance.
As of Wednesday, the metal was trading beneath its 200-day simple moving average with the daily RSI broken below 50 and the MACD deeply negative at -30.53. Those readings belong to a trend that broke, not one taking a rest. The August sequence explains how: gold rose nearly 14% across a three-week rally to near $4,700, then gave back 3.25% in a single week and lost the 200-day on the way down.
Related: Limoncello Spritz tops summer cocktail list
Central Banks and the Longer View
The structural bid beneath this market is official-sector demand, and it is indifferent to whether the Fed hikes in September. Central banks remain the largest gold holders on earth and have continued adding to reserves through the entire 2026 drawdown. The Dutch central bank disclosed that it transferred 86 metric tons of gold from New York and Ottawa to London over the past six months, describing the move as intended to improve tradability and strengthen crisis preparedness. “Crisis preparedness” is a reserve manager saying out loud that the tail risk being hedged is a functioning-market risk, not an inflation risk.
Perspective on the year matters because the current price sits between two extremes. Gold set its all-time high at $5,597.23 on January 29, 2026. From there the metal endured its worst quarter in 13 years, fell through the first half on interest rate fears, then bottomed and began recovering. The August rally to near $4,700, followed by the collapse to $4,282.67, leaves COMEX futures at $4,526.20 sitting roughly 19% below the January peak and 27% above the 52-week low of $3,511.19. The five-year return of 143.87% against 68.84% for the S&P 500 reframes all of it: a metal that has more than doubled the index over five years and is currently 20% off its high is a market in a correction, not a bear market — provided the correction holds.


Leave a Reply